AmazingStudio
AmazingStudio
Amazing Studio is our reporting tool that combines the results of advertising campaigns with key retail data in a single dashboard. Gain real-time insights to make strategic decisions and stand out in the competitive world of Amazon.
With Amazing Studio, you’ll have access to a comprehensive control panel to monitor the performance of your campaigns, track your sales, prices, Buy Box, and more, identifying growth opportunities and maximizing your return on investment.
Take your campaigns to the next level and achieve exceptional results on Amazon with Amazing Studio.
SPONSORED ADS
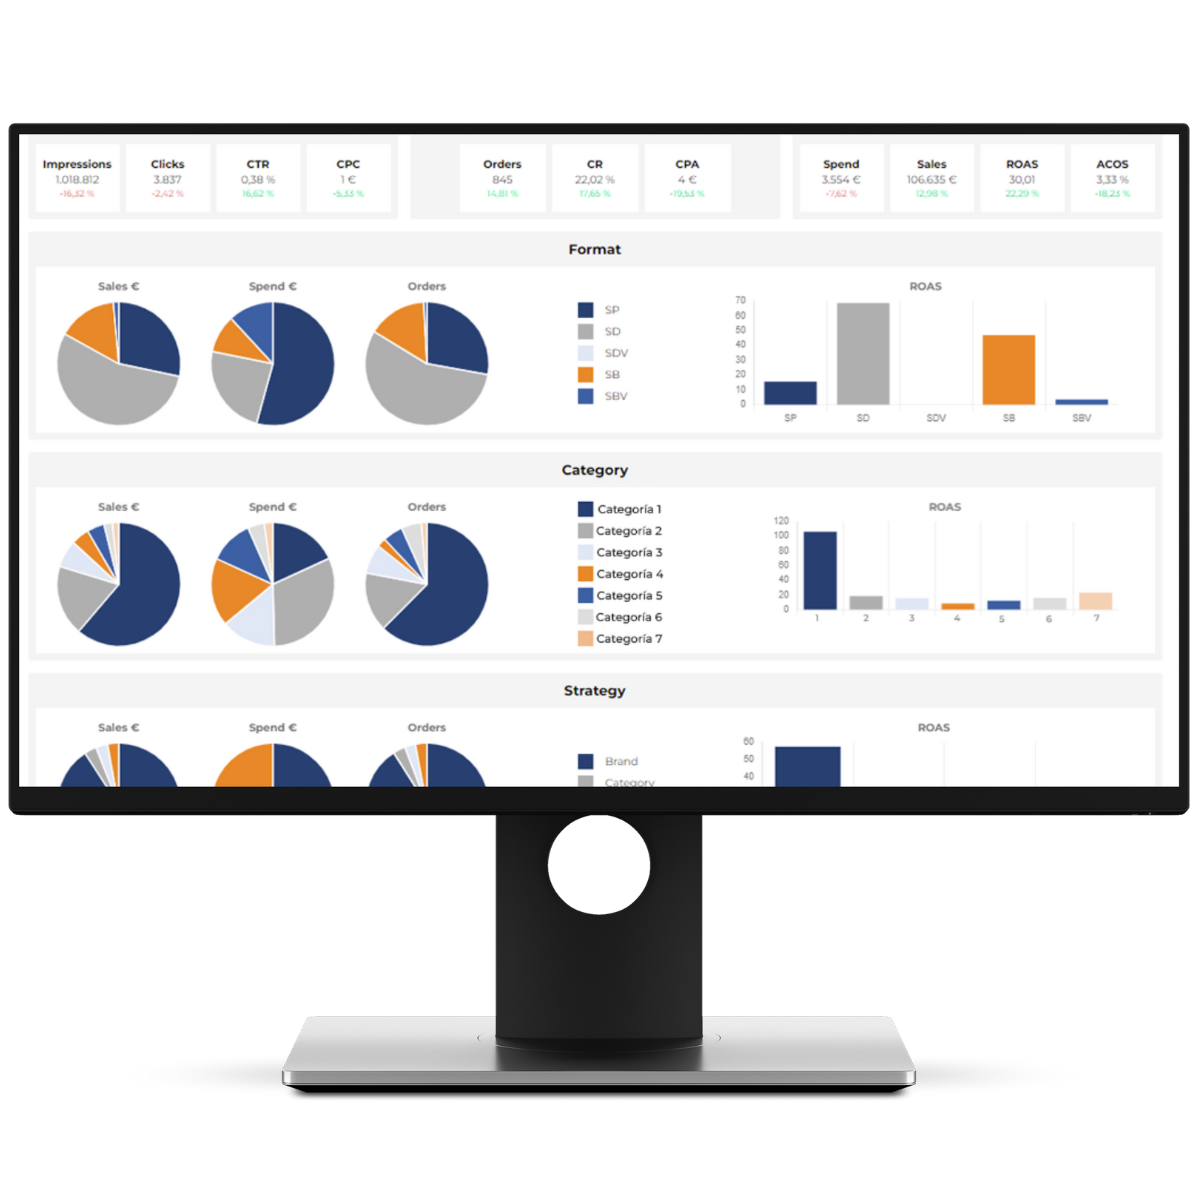
Discover our Sponsored Ads Reporting Dashboard in Amazing Studio. Gain a comprehensive and detailed view of your advertising campaigns’ performance on Amazon. Measure and control key metrics such as impressions, clicks, CTR, CPC, orders, conversion rate, acquisition cost, expenses, sales, ROAS, and ACOS.
With Amazing Studio, make strategic decisions based on accurate data and optimize your advertising results on Amazon. Obtain relevant information to elevate your campaigns to the next level and achieve success in the world of e-commerce.
DSP
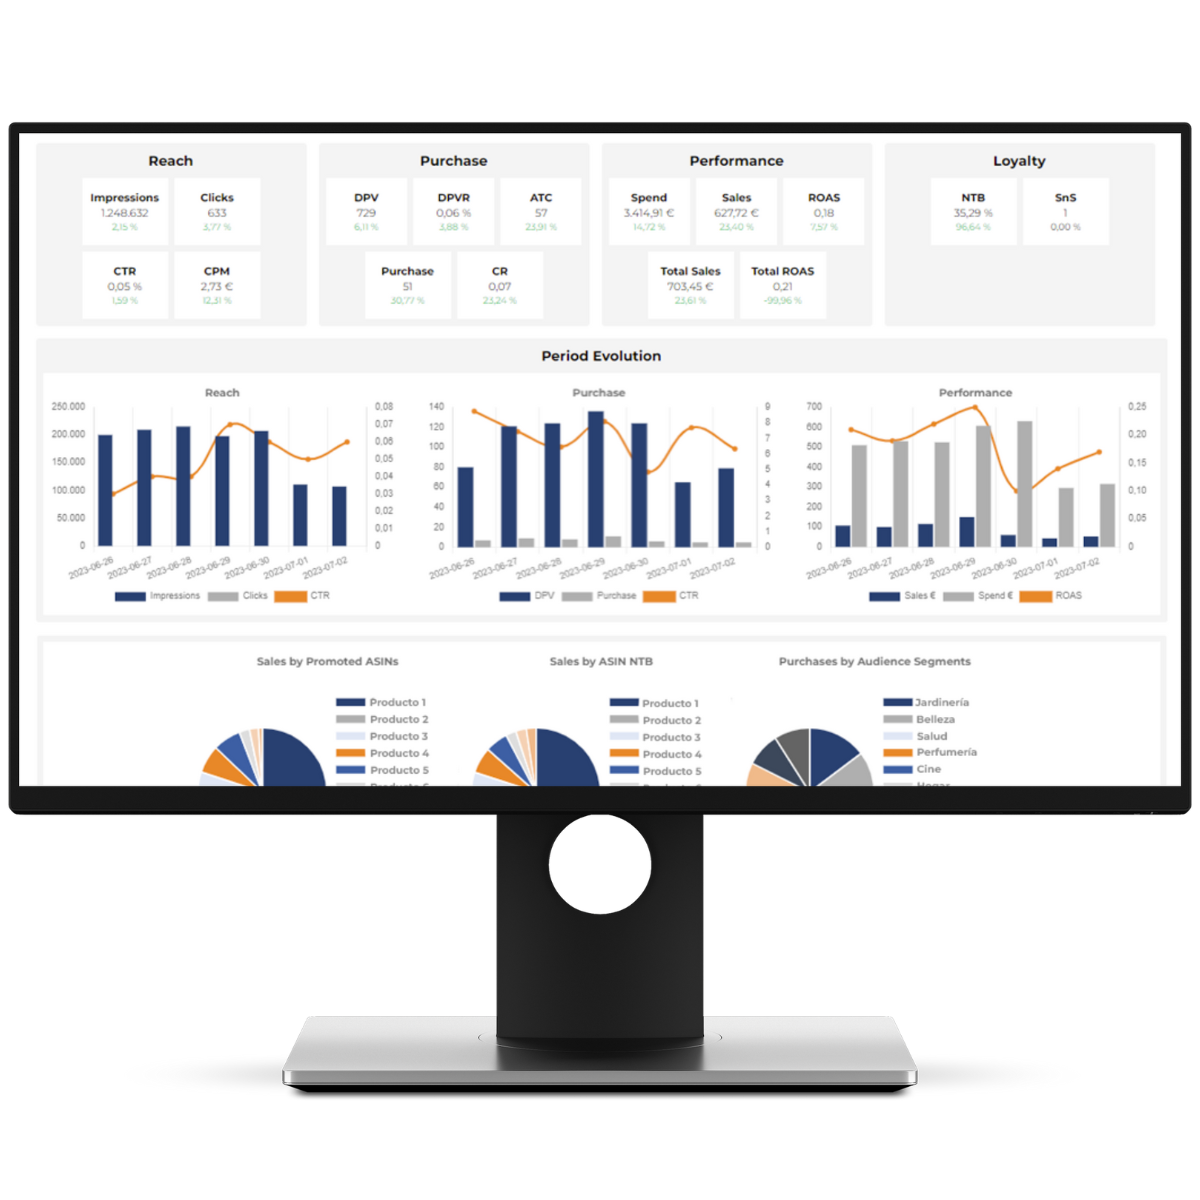
Gain a comprehensive view of your advertising campaigns on Amazon and optimize your DSP strategies. Access essential metrics such as reach, impressions, clicks, click-through rate (CTR), and cost per thousand impressions (CPM).
Furthermore, analyze user behavior with the product through metrics like product detail views (DPV), product detail view rate (DPVR), add-to-cart (ATC) actions, purchases, and conversion rate (CR).
Measure performance in terms of spending, sales, advertising return on investment (ROAS), total sales, and total return on investment (Total ROAS). Lastly, obtain valuable metrics related to customer loyalty, such as the number of new customers (NTB) and repeat customers (SnS).
BUY BOX TRACKER
This dashboard, included in our Amazing Studio, is a unique tool in the market. With it, you will obtain valuable information about the performance of your products in terms of gaining or losing the Buy Box in your product portfolio. Gain a comprehensive view of the overall performance of your catalogue, as well as specific details per ASIN. Identify the best and worst performing ASINs in relation to this KPI and receive price recommendations for products that are struggling to win the Buy Box.
You will also have a section that shows which products in your catalogue currently have any Amazon tags, such as the “Amazon’s Choice” option.
ASIN PRIORIZATION
Explore this section where you can monitor and evaluate the performance of your Amazon catalogue by ASIN.
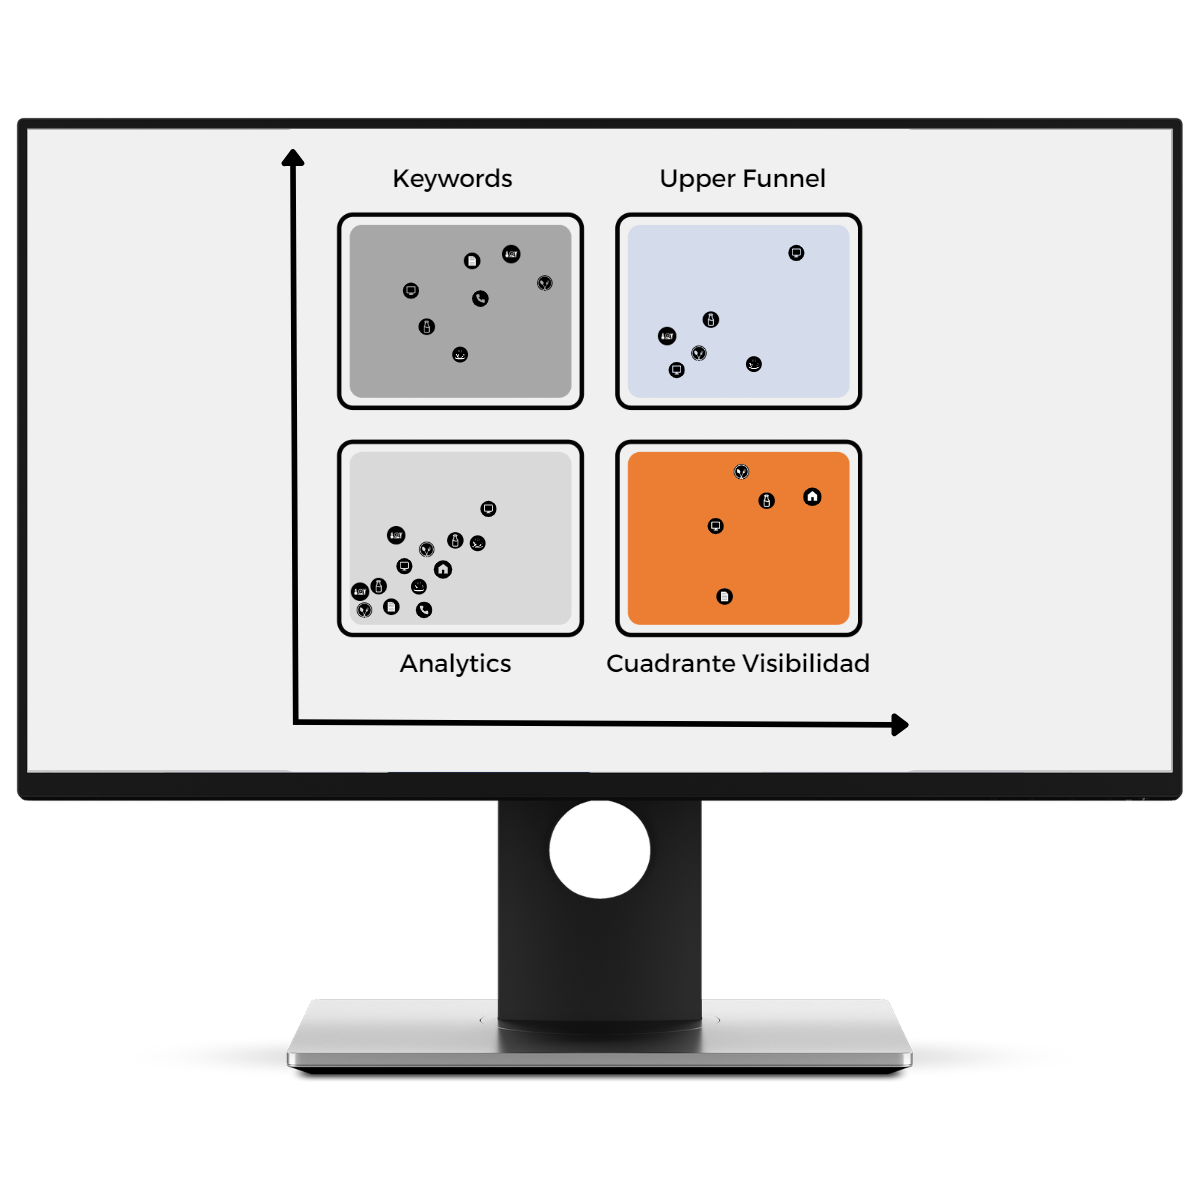
With a quick and visual glance, you will obtain crucial information to prioritize or deprioritize ASINs based on the data collected from both advertising and retail. This feature allows you to react and make swift decisions that can directly impact your overall results on Amazon.
Maintain full control over your catalog and optimize your strategies to achieve maximum performance in the marketplace.
VENDOR REPORT
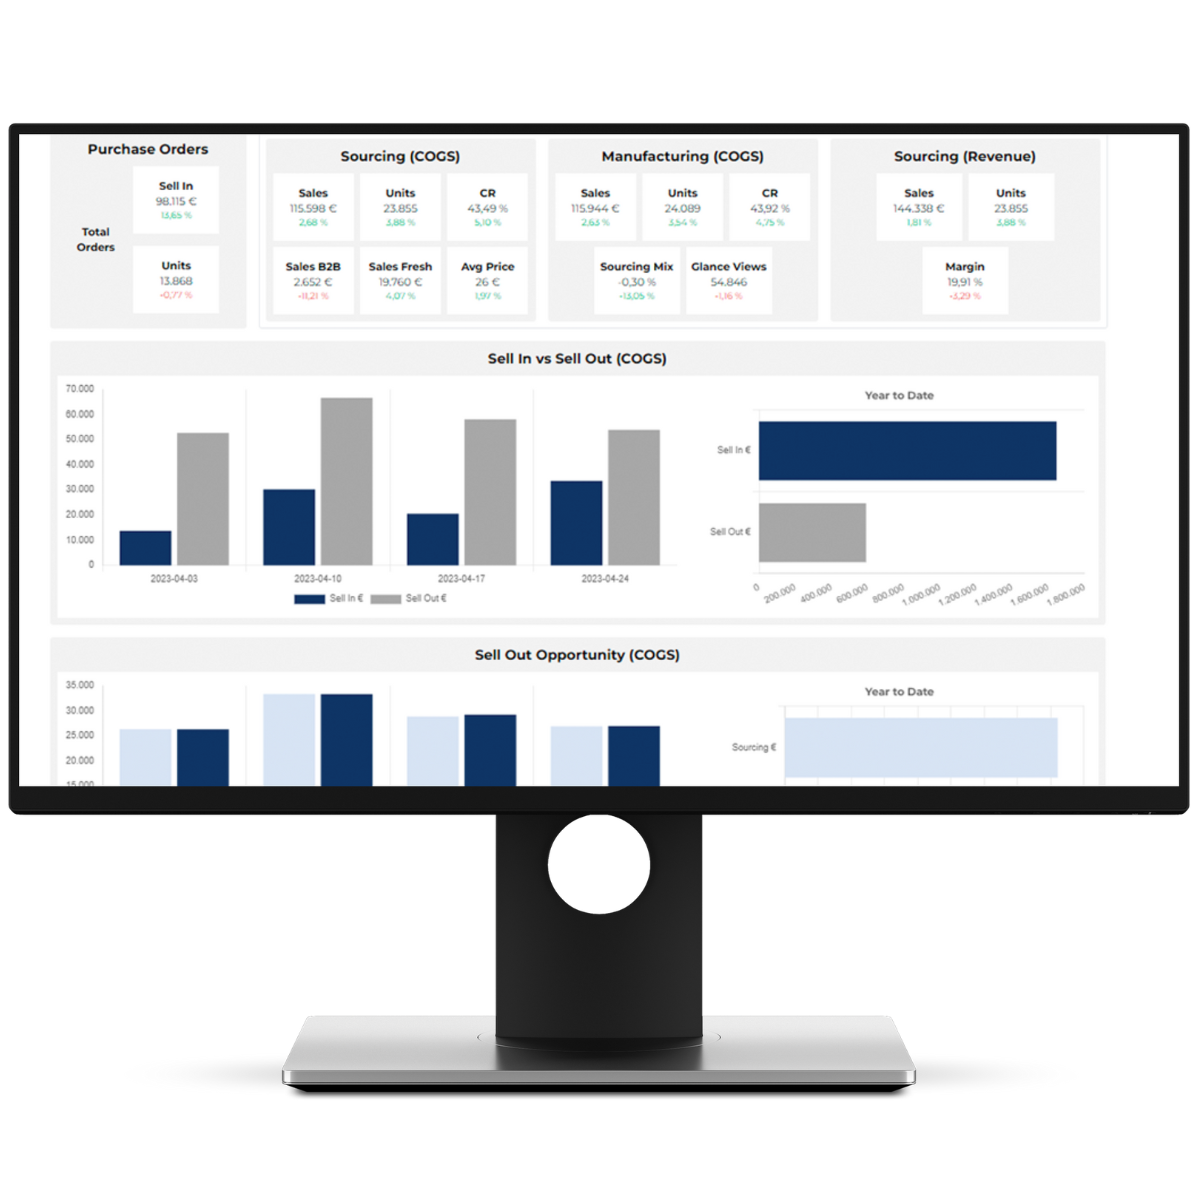
In this dashboard, you will gain a quick and accurate overview of all the information related to your Sell-In and Sell-Out. From total sell-in figures and units requested, allowing you to assess overall performance, to detailed data on COGS from both sources and manufacturing. You can view the breakdown of sales by Marketplace platform, business, and even Fresh, as well as the average selling price of your product.
But it doesn’t end there; you also have an income section with information on total sales, units, and margins.
SELLER REPORT
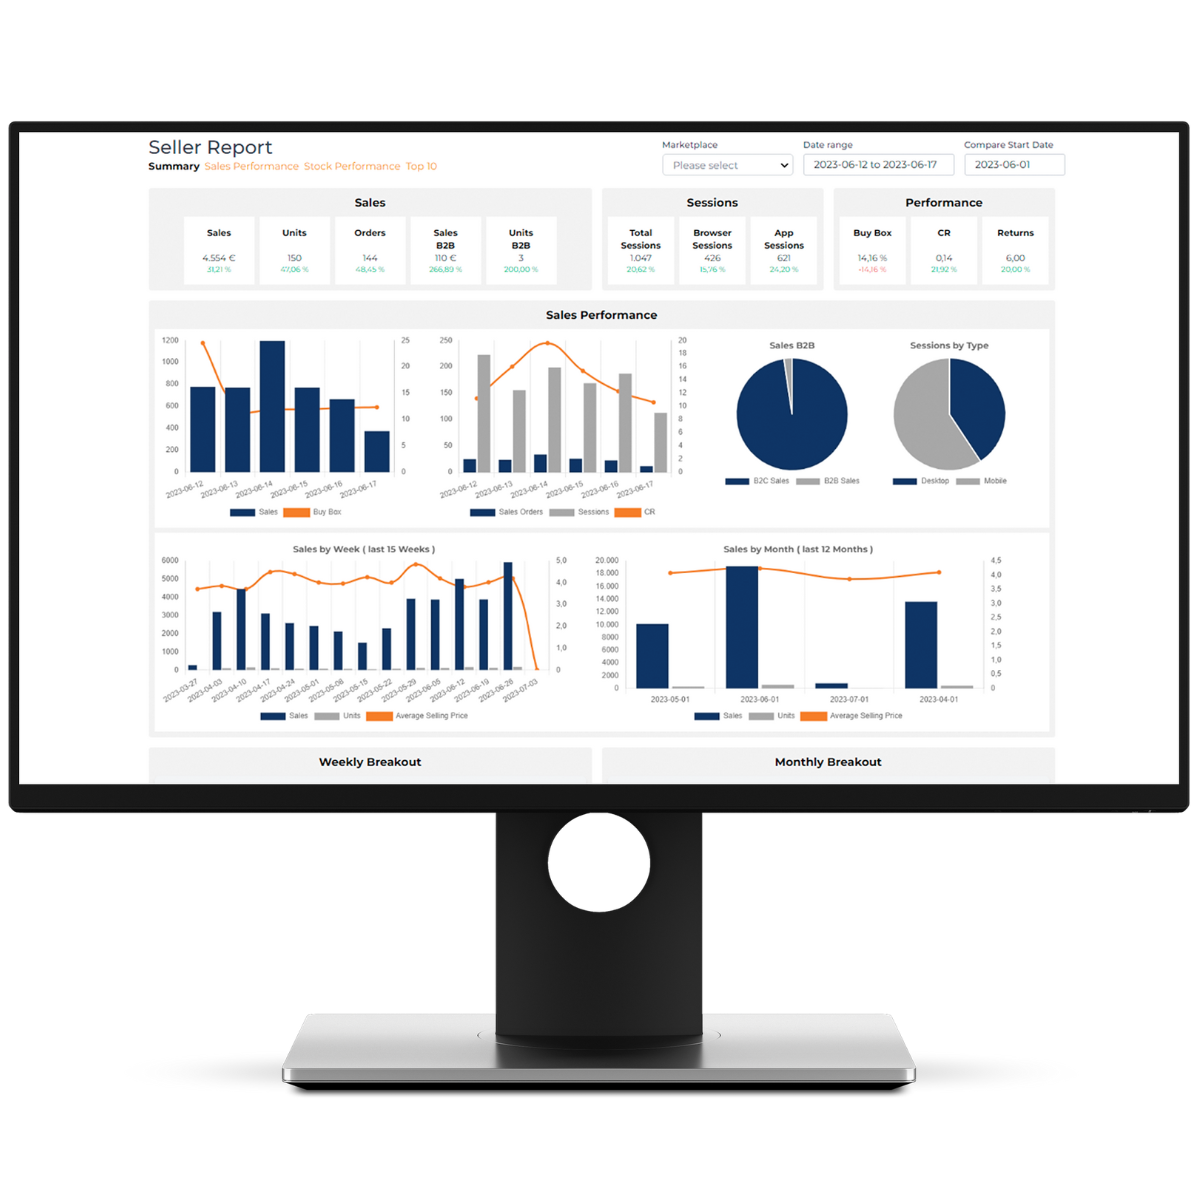
In our Amazing Studio Seller Report, you will access key sales figures and the main performance indicators (KPIs) to measure your success. Get updated data on a daily, weekly, and monthly basis, including B2B sales. Furthermore, the Seller Report provides insights from the sessions, specifying whether they come from the Amazon website or the app, as well as whether they come from mobile devices or computers.
Of course, performance data is also included, encompassing metrics such as Buy Box, conversion rate (CR), and returns. Thanks to the Seller Report, you’ll have a comprehensive and detailed view of your sales and performance on Amazon, empowering you to make strategic decisions and further propel your success in the marketplace.

SPONSORED ADS
Discover our Sponsored Ads Reporting Dashboard in Amazing Studio. Gain a comprehensive and detailed view of your advertising campaigns’ performance on Amazon. Measure and control key metrics such as impressions, clicks, CTR, CPC, orders, conversion rate, acquisition cost, expenses, sales, ROAS, and ACOS.
With Amazing Studio, make strategic decisions based on accurate data and optimize your advertising results on Amazon. Obtain relevant information to elevate your campaigns to the next level and achieve success in the world of e-commerce.

DSP
Gain a comprehensive view of your advertising campaigns on Amazon and optimize your DSP strategies. Access essential metrics such as reach, impressions, clicks, click-through rate (CTR), and cost per thousand impressions (CPM).
Furthermore, analyze user behavior with the product through metrics like product detail views (DPV), product detail view rate (DPVR), add-to-cart (ATC) actions, purchases, and conversion rate (CR).
Measure performance in terms of spending, sales, advertising return on investment (ROAS), total sales, and total return on investment (Total ROAS). Lastly, obtain valuable metrics related to customer loyalty, such as the number of new customers (NTB) and repeat customers (SnS).
BUY BOX TRACKER
This dashboard, included in our Amazing Studio, is a unique tool in the market. With it, you will obtain valuable information about the performance of your products in terms of gaining or losing the Buy Box in your product portfolio. Gain a comprehensive view of the overall performance of your catalogue, as well as specific details per ASIN. Identify the best and worst performing ASINs in relation to this KPI and receive price recommendations for products that are struggling to win the Buy Box.
You will also have a section that shows which products in your catalogue currently have any Amazon tags, such as the “Amazon’s Choice” option.

ASIN PRIORIZATION
Explore this section where you can monitor and evaluate the performance of your Amazon catalogue by ASIN.
With a quick and visual glance, you will obtain crucial information to prioritize or deprioritize ASINs based on the data collected from both advertising and retail. This feature allows you to react and make swift decisions that can directly impact your overall results on Amazon.
Maintain full control over your catalog and optimize your strategies to achieve maximum performance in the marketplace.

VENDOR REPORT
In this dashboard, you will gain a quick and accurate overview of all the information related to your Sell-In and Sell-Out. From total sell-in figures and units requested, allowing you to assess overall performance, to detailed data on COGS from both sources and manufacturing. You can view the breakdown of sales by Marketplace platform, business, and even Fresh, as well as the average selling price of your product.
But it doesn’t end there; you also have an income section with information on total sales, units, and margins.

SELLER REPORT
In our Amazing Studio Seller Report, you will access key sales figures and the main performance indicators (KPIs) to measure your success. Get updated data on a daily, weekly, and monthly basis, including B2B sales. Furthermore, the Seller Report provides insights from the sessions, specifying whether they come from the Amazon website or the app, as well as whether they come from mobile devices or computers.
Of course, performance data is also included, encompassing metrics such as Buy Box, conversion rate (CR), and returns. Thanks to the Seller Report, you’ll have a comprehensive and detailed view of your sales and performance on Amazon, empowering you to make strategic decisions and further propel your success in the marketplace.
